Home Weather Station
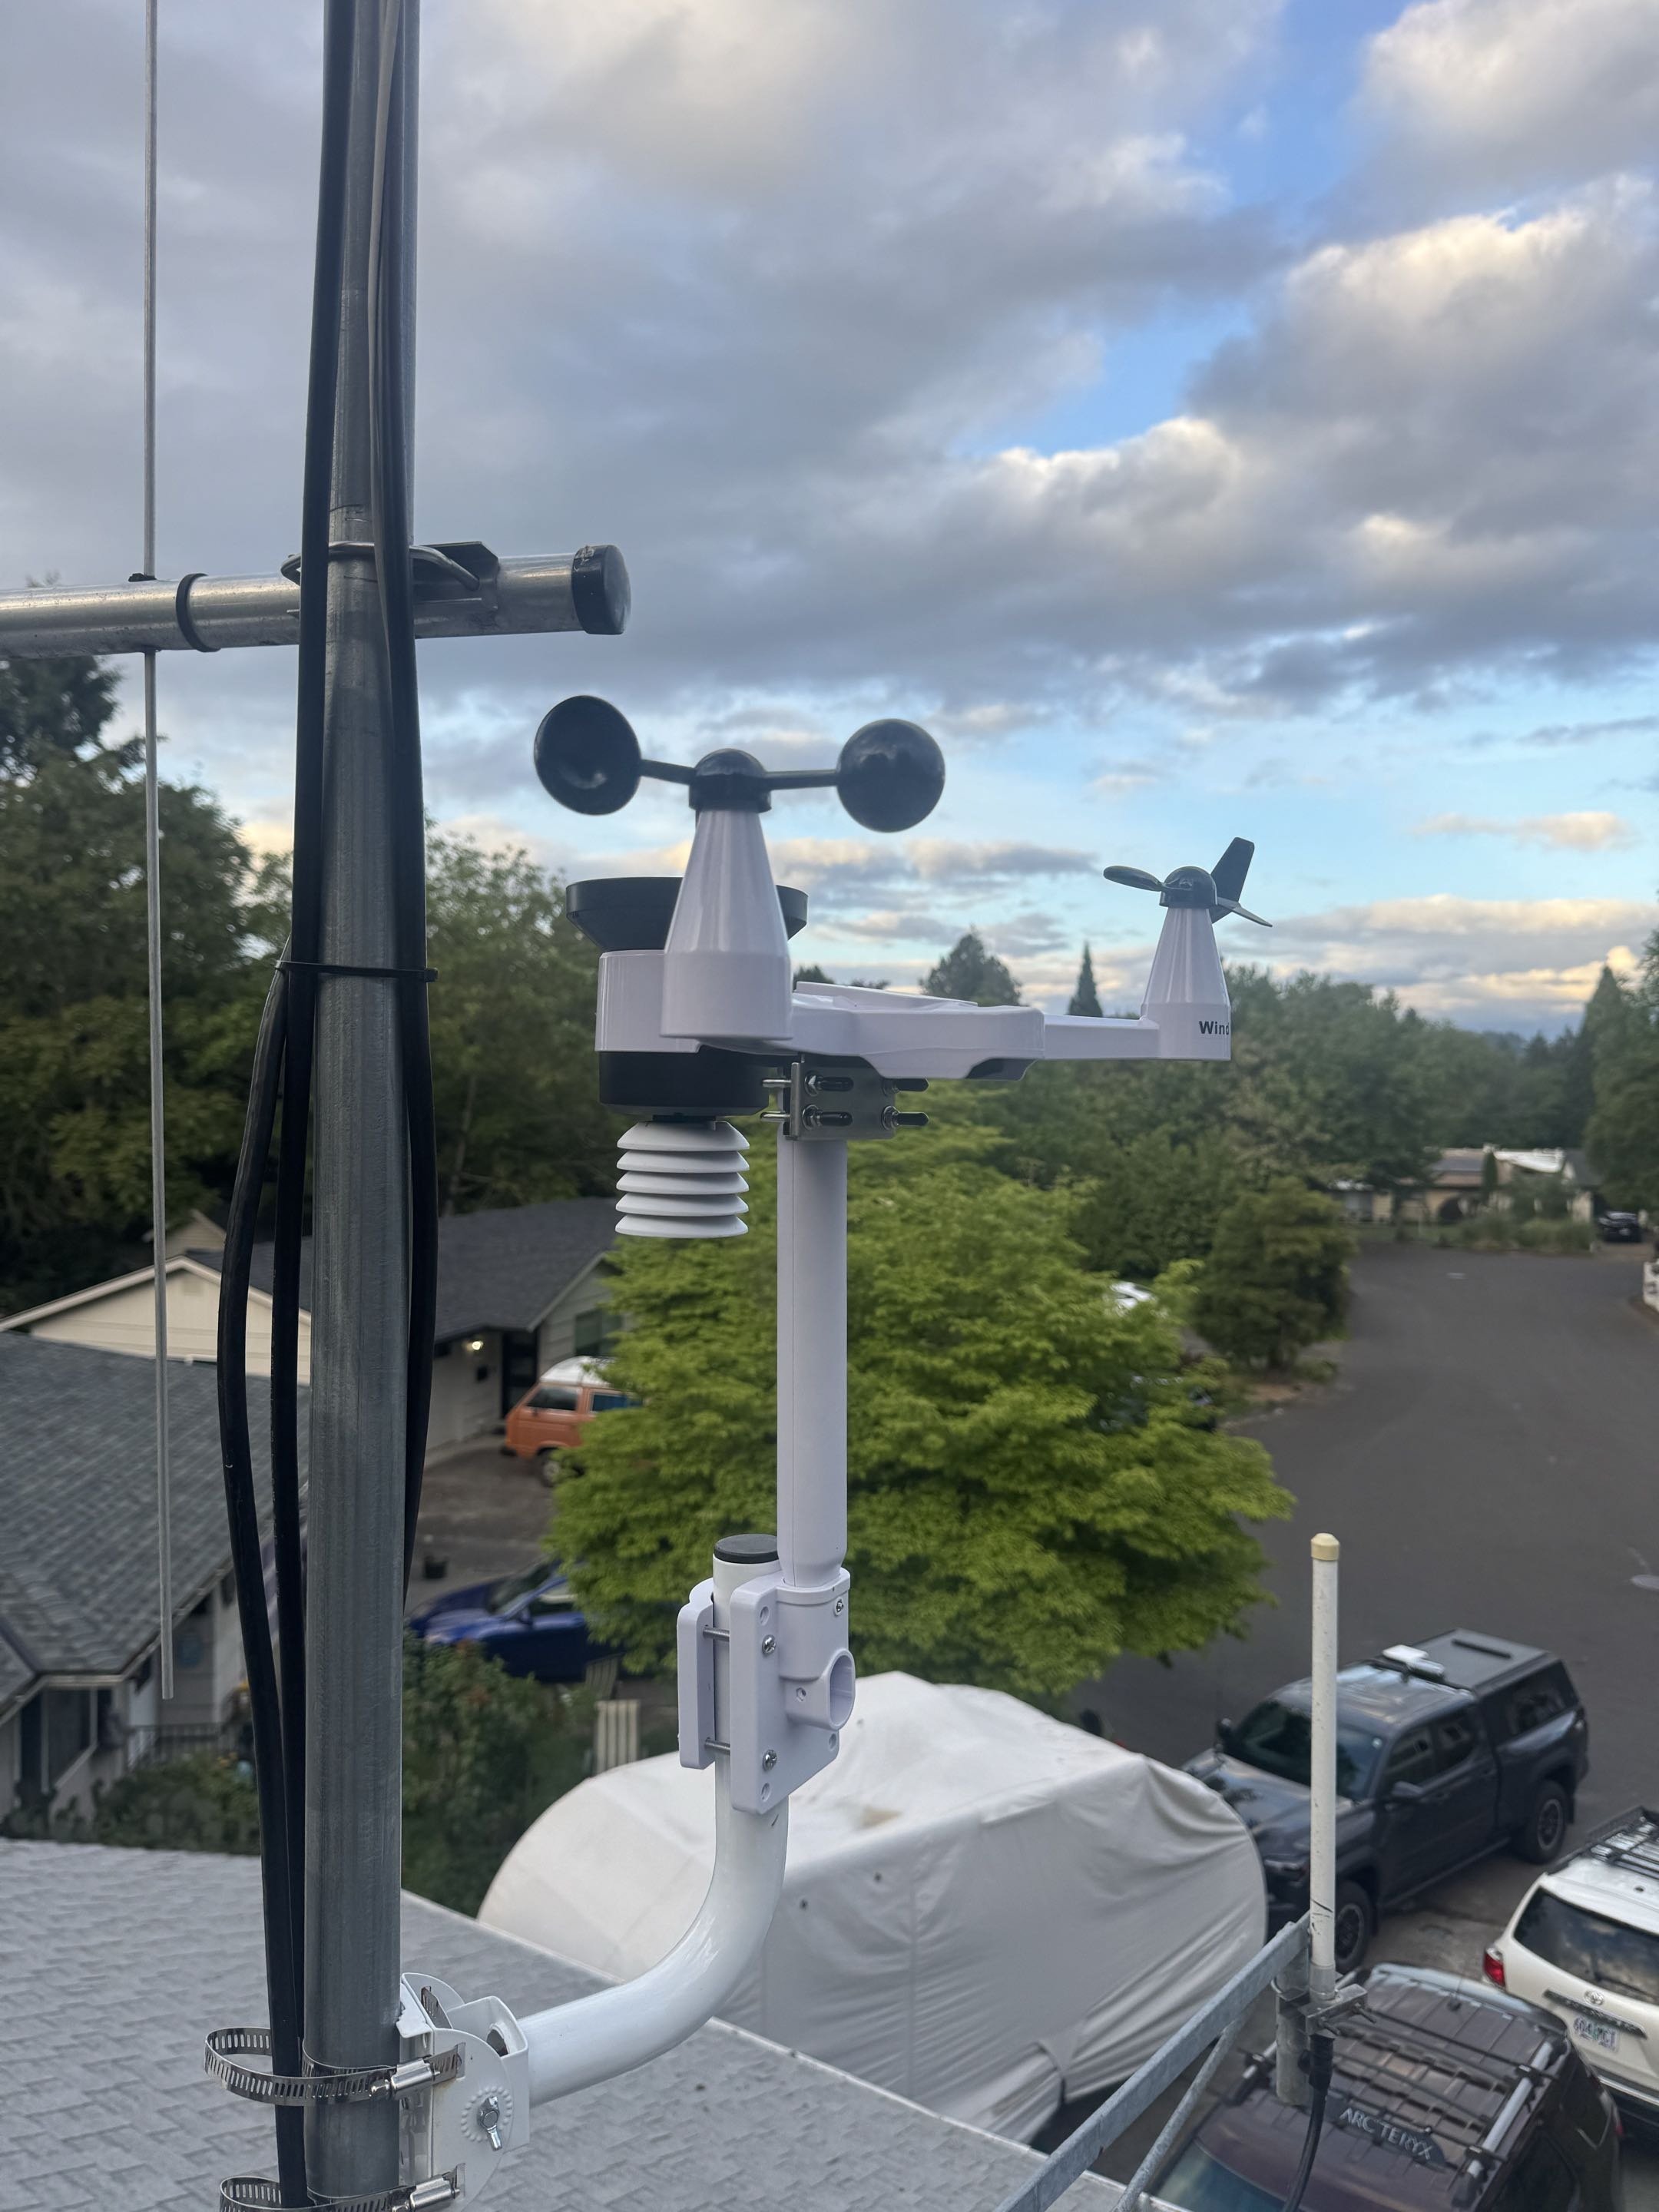
A while back I set up a small weather station project at my house in Milwaukie, Oregon.
The original goal was pretty simple: collect the weather data on my network and store it somewhere that I could graph and look back at later.
I learned using the inspect tool on the HTTP configuration page that the weather station serves raw data in JSON format when you connect the station to Wi-Fi at this endpoint: “/client?command=record”. The weather station serves this data, then I have a small program that scrapes and converts the readings into metrics that Prometheus can collect.
Prometheus stores the measurements over time, and I use Grafana to actually visualize everything.
The setup looks something like this:
Weather Station
↓
Local Data Collector
↓
Prometheus
↓
Grafana
Grafana gives me dashboards where I can see things like temperature, humidity, and other weather measurements over time instead of only seeing what the conditions are right now.
One of the main reasons I wanted to use Prometheus was that I already use it for monitoring a lot of other equipment and systems around my network. Adding weather data meant it could become another source of telemetry alongside servers, networking equipment, temperature sensors, and other projects.
The nice part about storing everything in Prometheus is that I can go back and look at historical data. I can see how temperatures changed during the day, compare different days, or eventually use the data for alarms and other automation.
More recently, I also built
I have a future idea to build my own 433MHz receiver and decode and serve the data in the native format for Prometheus. This will completely eliminate the need for the handler script and simplify everything to a very deployable/portable setup. This could also integrate to APRS or Meshtastic in the future as an all-in-one device.
It’s a pretty simple project, but it’s been a fun way to combine weather monitoring, networking, Linux, Prometheus, Grafana, and some custom software into one system.