Over the past few months, I have realized how inconvenient it is to view the statistics of my server over time. When I'm at home, I was using HWinfo remote to monitor my servers. This was really inconvenient because I couldn't use this remotely on my phone. I was also using my stream deck to monitor data like my indoor/outdoor temp and humidity. I needed to find a better way to scrape, format and view telemetry data from my embedded systems. I was recommend Grafana in December of 2020 by Nate Sales who is a good friend of mine and a fellow young electrical/software/networking hobbyist. As soon as I understood the basics of how it works, I couldn't stop playing with it!
System Overview
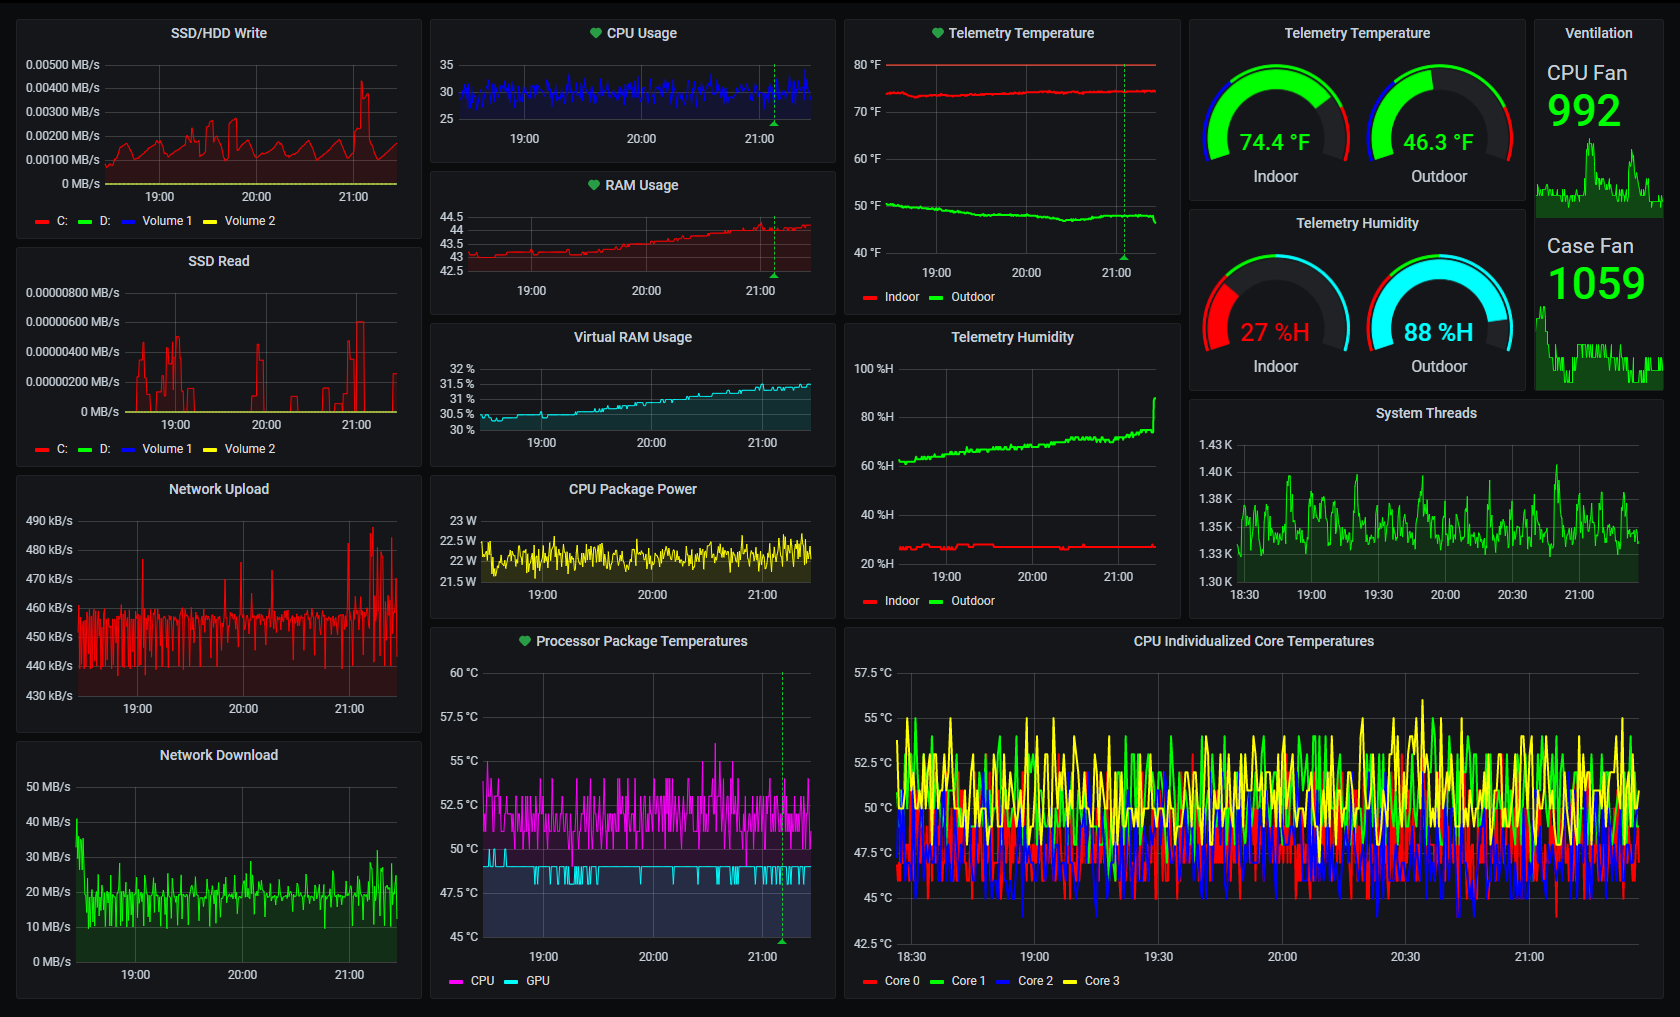
Grafana
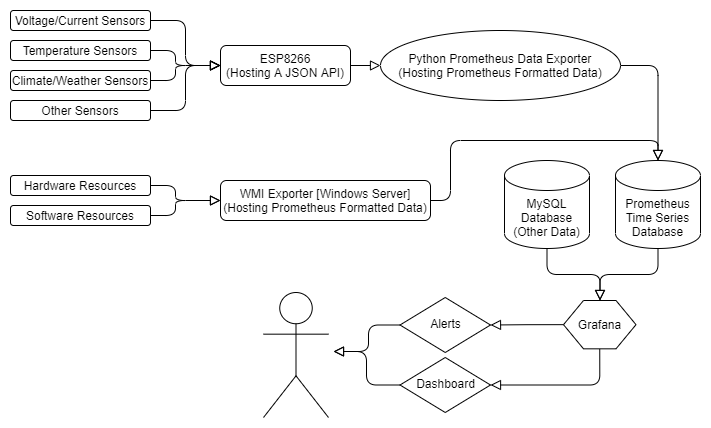
Grafana is an open source data visualizer that retrieves data from a specified database. Grafana has a plethora of visualization options to help you understand your data. I use Grafana to retrieve data from MySQL & Prometheus databases analog with external sources such as Google Sheets and Google Calendar. Grafana as has the ability to set thresholds for alerting. When data meets the alert criteria, its able to execute actions to services like sending an email over STMP (Simple Mail Transfer Protocol) or sending a Discord message via a Webhook through the Discord API. The most useful function of alerting for me so far has been the ability to send POST requests to a specified URL. This allowed me to activate custom actions like displaying the alert information on an LED sign or setting off an alarm/light.
MySQL
MySQL is a well known and widely deployed database. You can imagine MySQL as a spreadsheet because that's exactly what it is. If you were to put a unix timestamp as the primary key column and put data on that row in the form of intrigues, you could retrieve and graph this data using Grafana. I ended up using this for my first tests but when the table became over 45,000+ rows I started to have problems. MySQL workbench would crash when I tried to view the table and I ended up having to delete the table from the console on the server. I still use it for things like visualizing user inputs from HTML/PHP forms I have built because its the proper use of MySQL. I really needed to store my data points in a proper time series database, that's where Prometheus came in.
Prometheus
Prometheus is an open source time series database that is built especially for this application. Unlike MySQL, Prometheus is made to handle time series data. Prometheus can send a GET request to multiple data sources, log the data in the database and keep a continuous cache size. The continuous cache size is one of the most important parts. This means that you will always have a continuous amount of data stored. For instance, your Prometheus database can be setup to store the data retrieved from the previous 7 days, any data after that is overwritten/deleted. This gives you 7 days of data to review to give you time to find an issue and doesn't take up server storage for outdated data. I will point out however, if you need to archive your data for whatever reason, there is "black box" type options available for those use cases.
WMI Exporter
WMI Exporter is an open source data scraper for Windows 10 & Windows Server 2019. WMI Exporter gets the data from your hardware sensors and returns resource usage values. This hosts the live data for Prometheus to scrape the data and save it to the database for later viewing with Grafana.
Python Prometheus Data Exporter
I built a custom data scraper for Prometheus using python. This takes data from my preexisting hardware (such an my ESP8266 devices) that hosts JSON API data and converts that data to the Prometheus format. I then host this data using the python flask library for Prometheus to then scrape the data from. Currently, I haven't released the source code for this but I plan to once its finished.
ESP8266 Telemetry
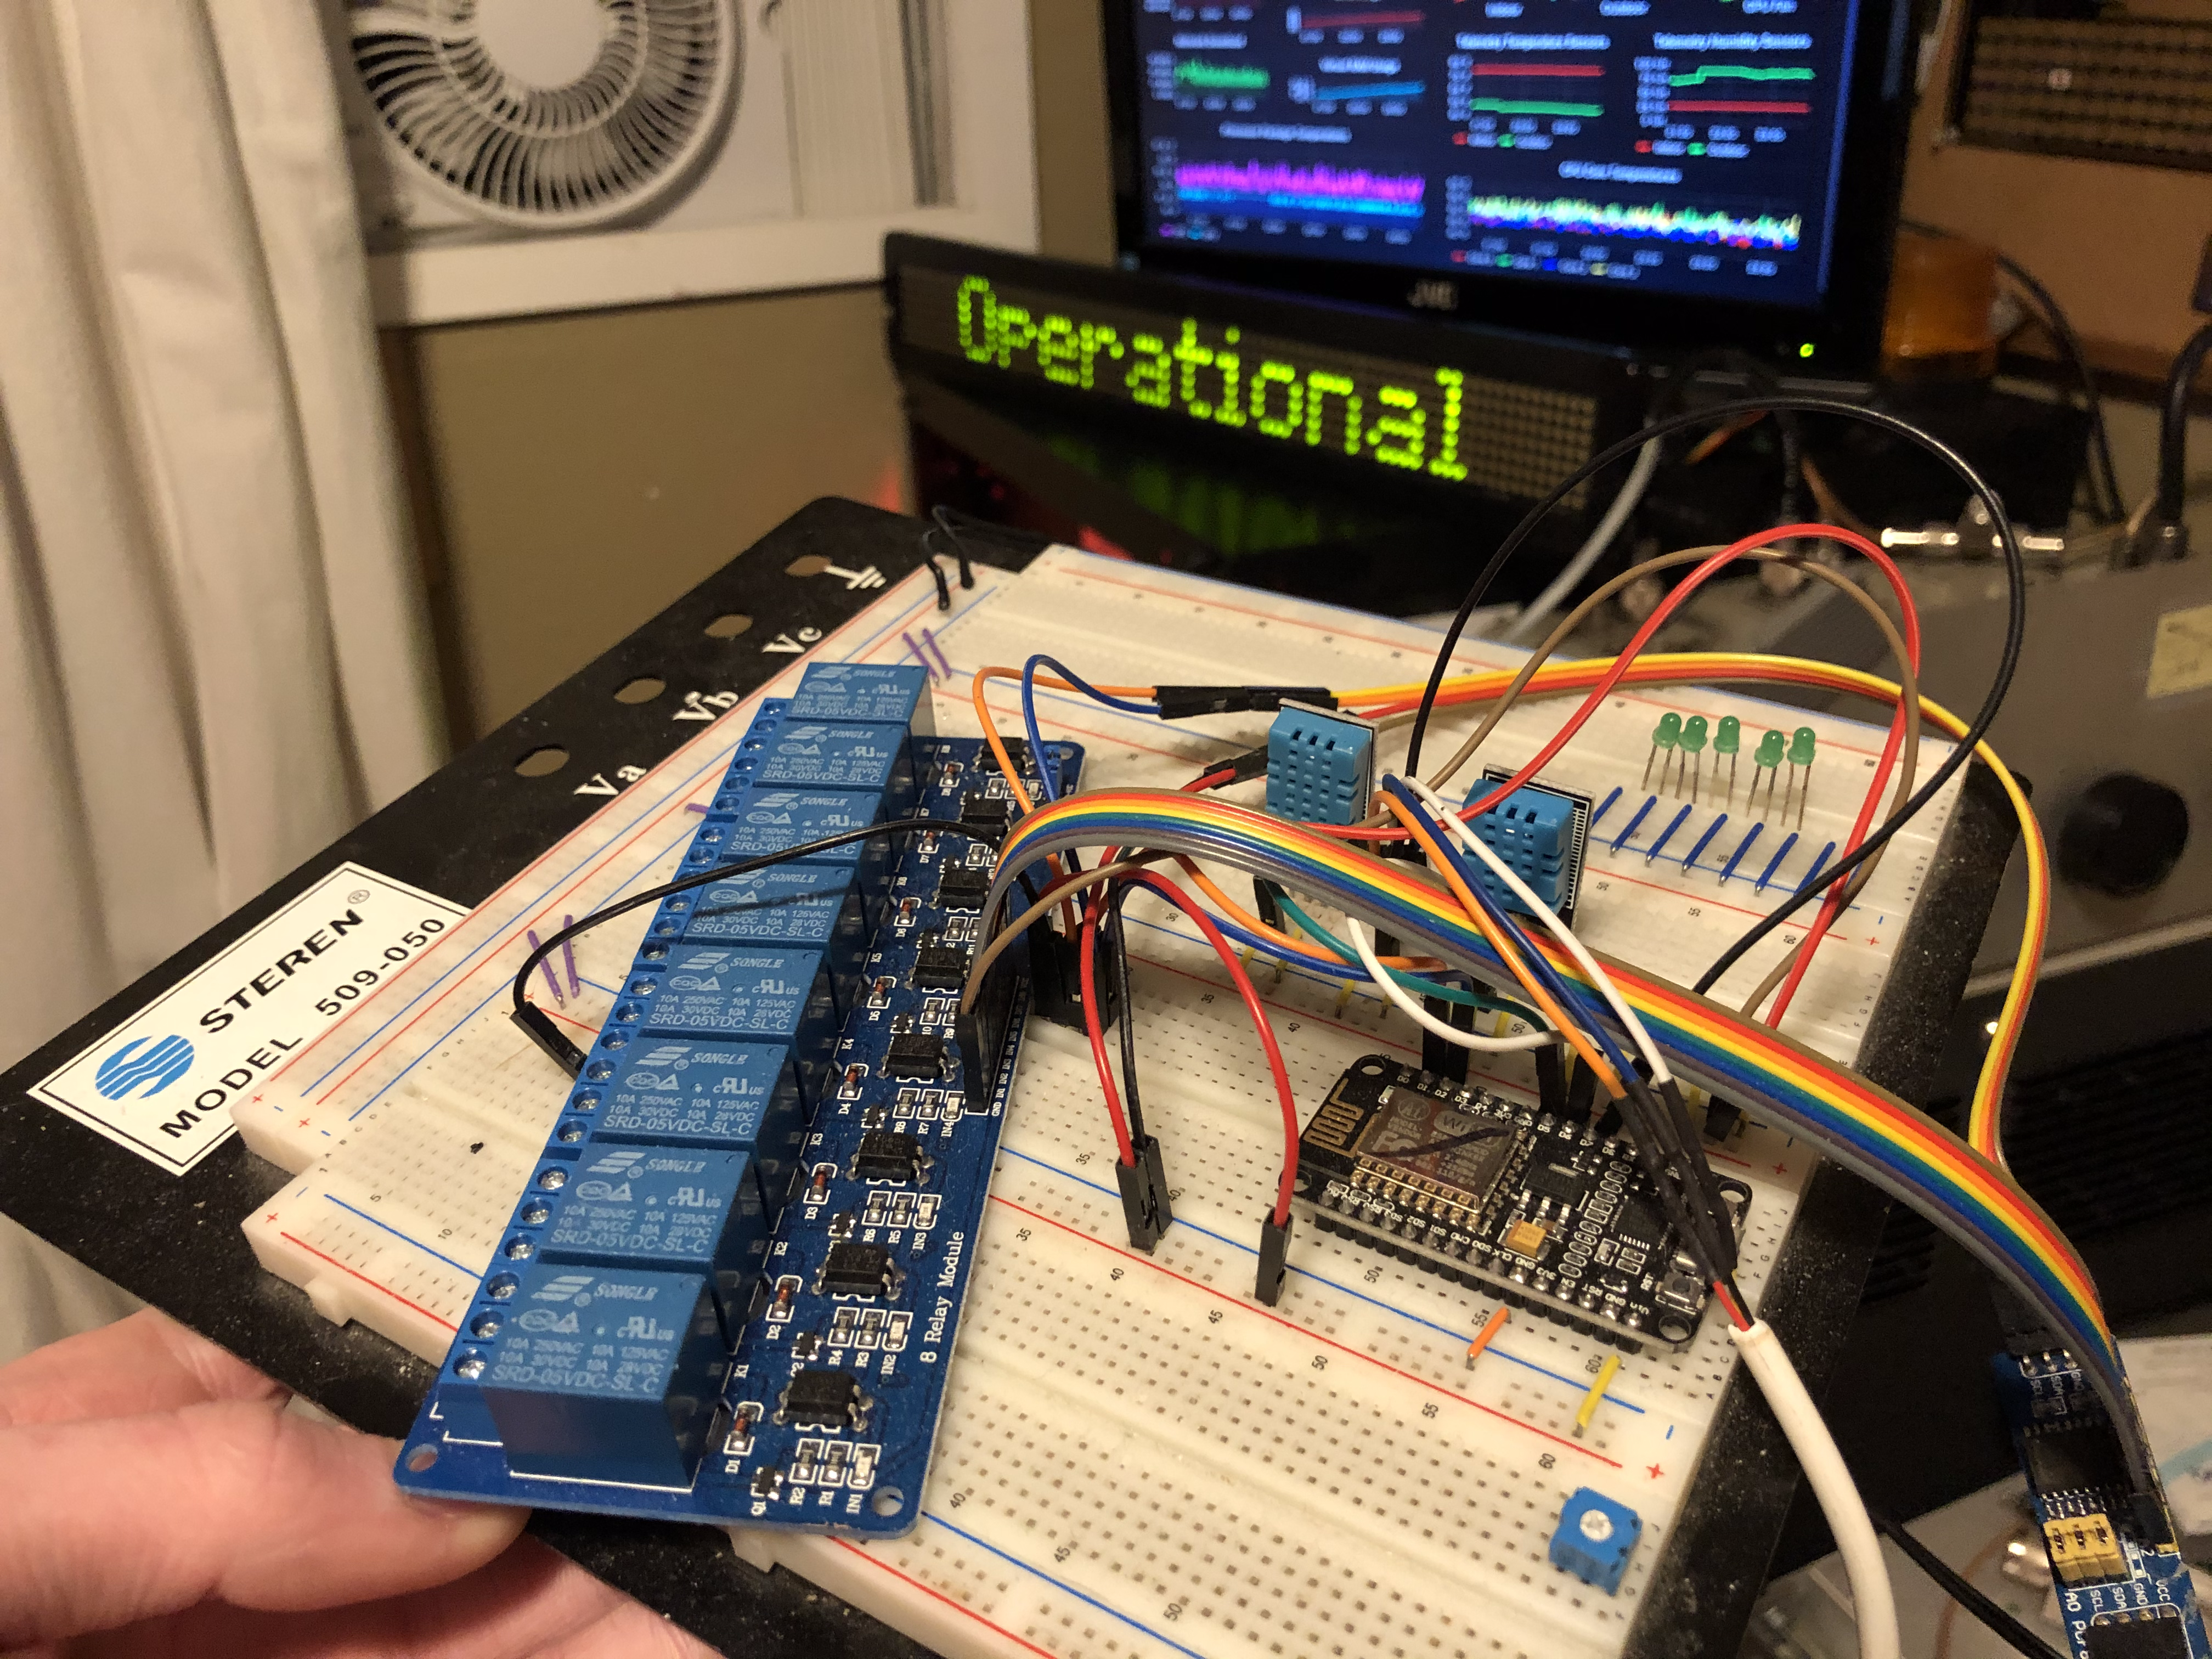
Although this could be a completely separate blog post (and will probably become one), I want to point it out. Pictured below is the main ESP8266 I use for interfacing to hardware sensors. This then hosts a JSON API that my Python script (mentioned above) gets a query from. This sort of flexibility allows me to interface voltage sensors, temperature sensors, air quality sensors and other climate/telemetry data sensors to my software projects. I know it looks messy. I have plans to get a PCB printed and build a custom housing for the system as this is going to be a permanent edition.
Betabrite LED Sign API
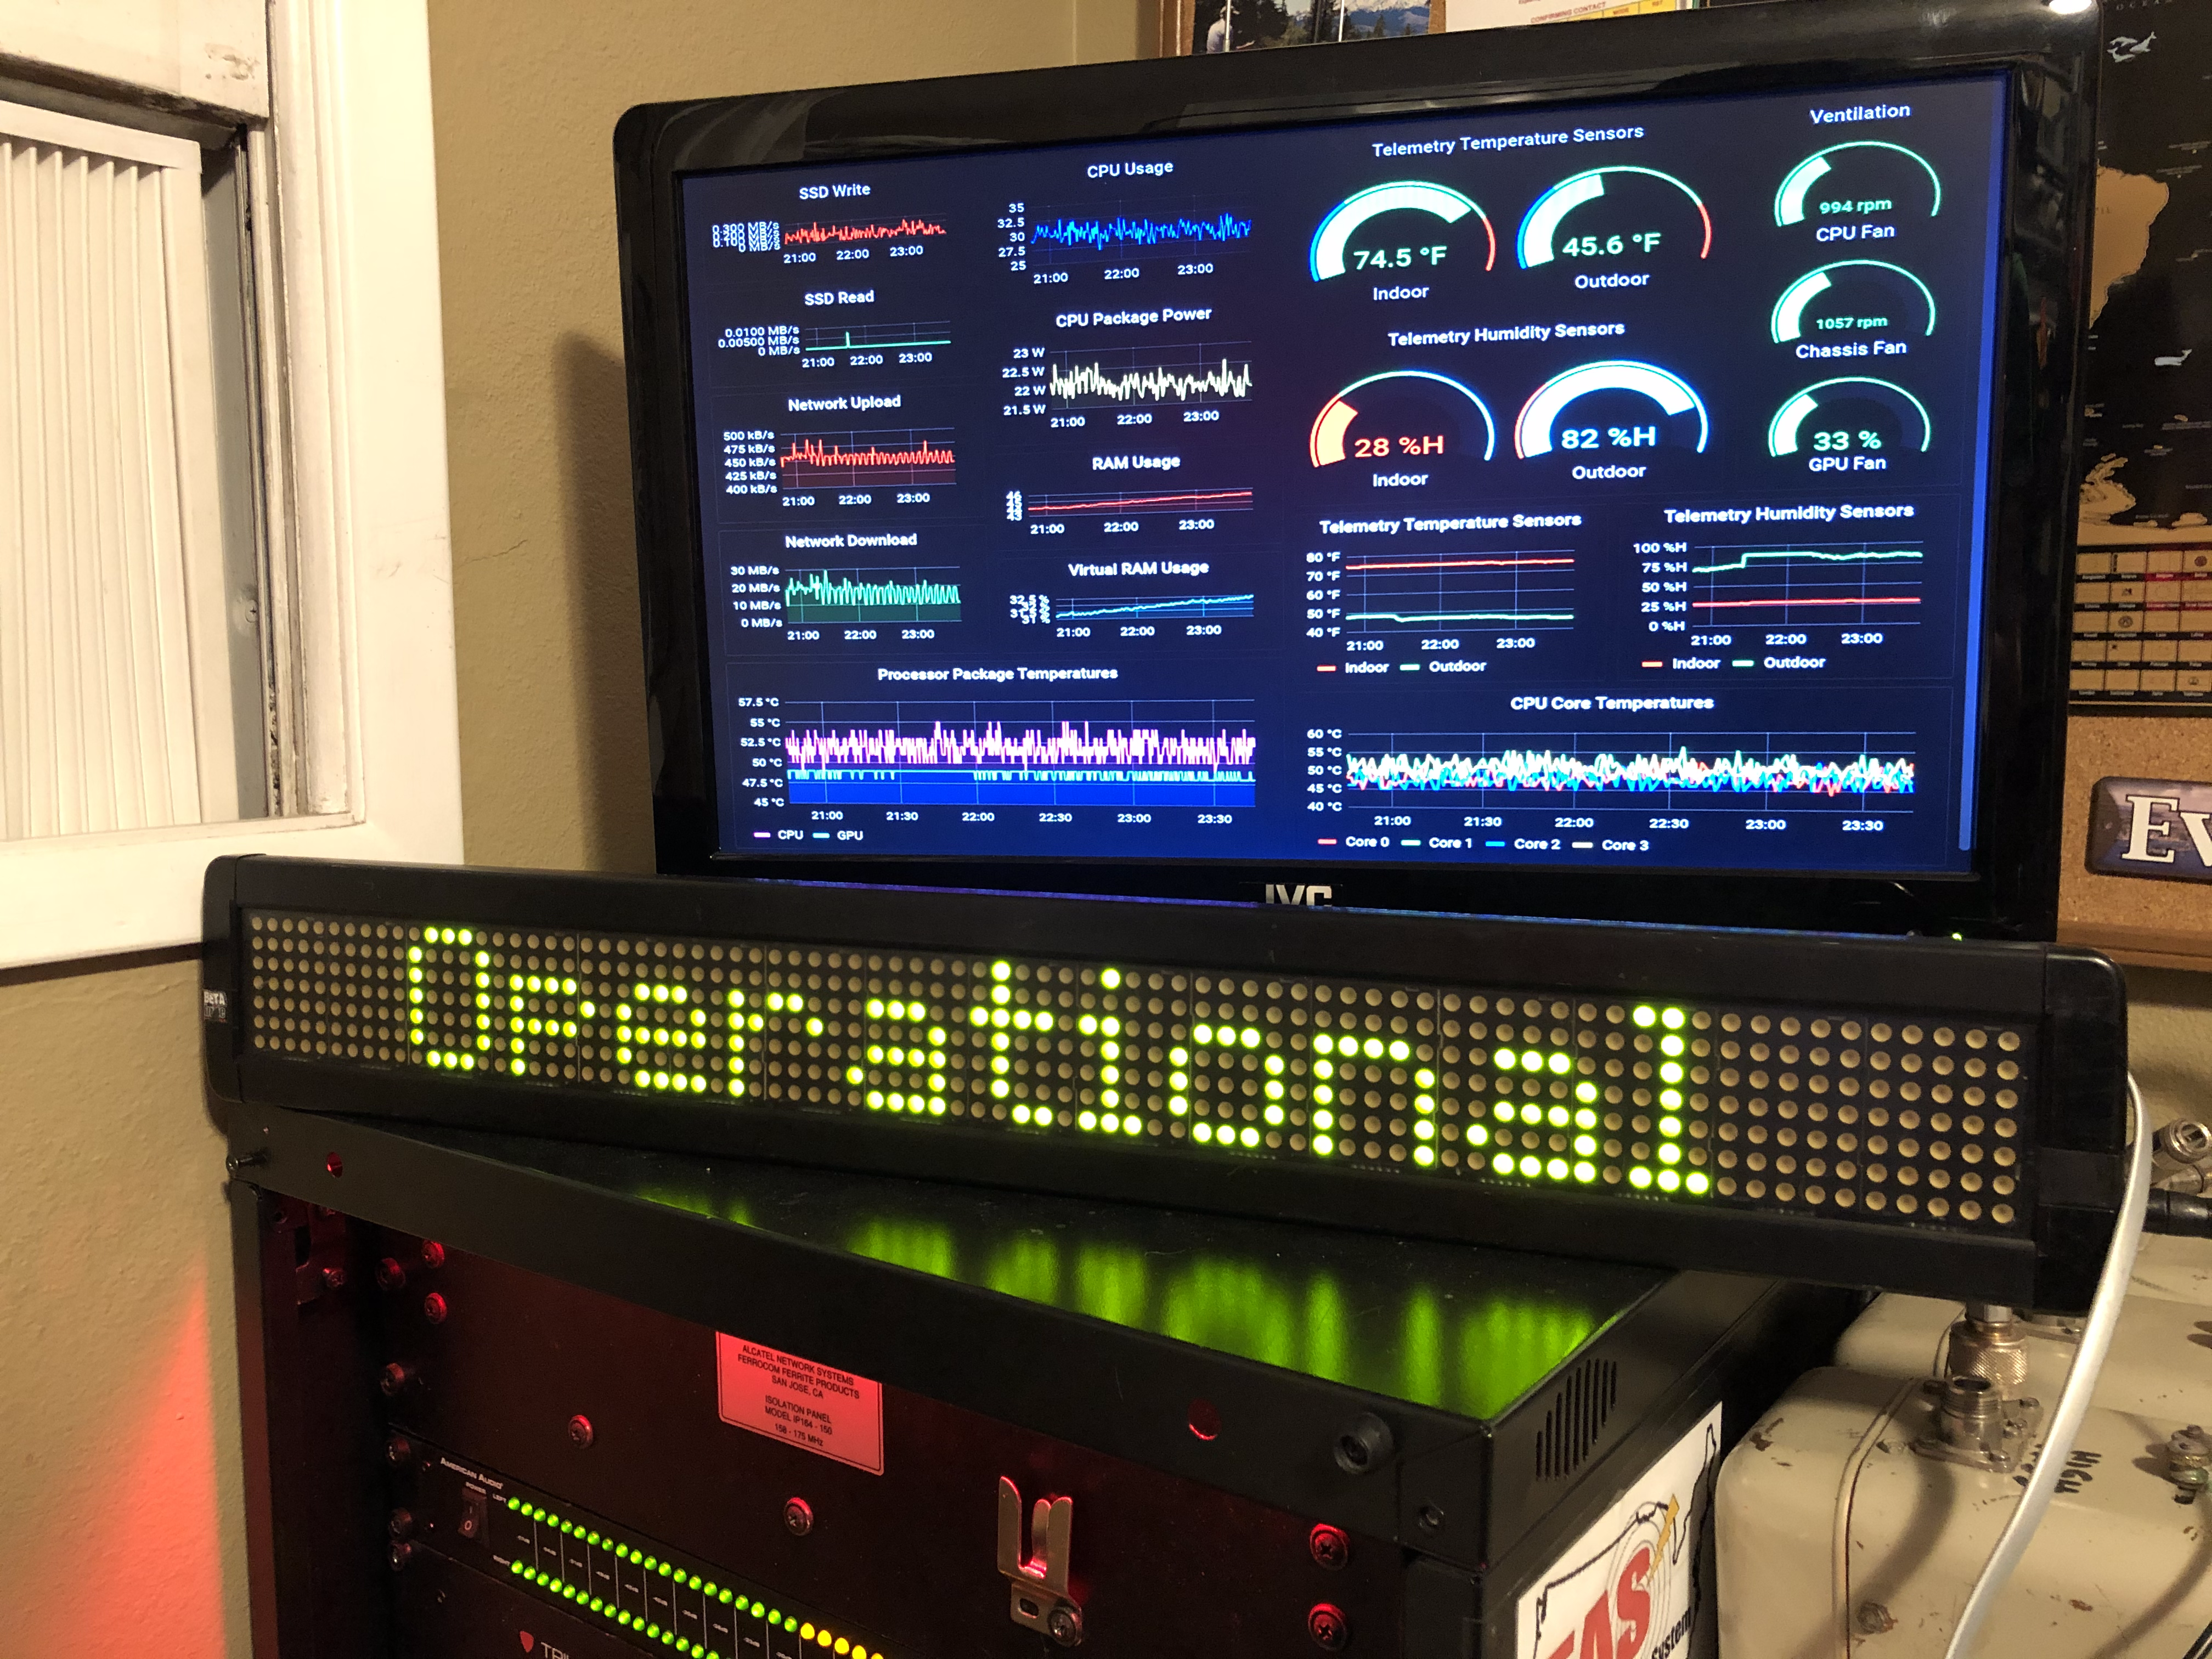
I have a custom built Python script that takes in POST requests from Grafana when there is an alert. The sign will beep 3 times and scroll the alert message in red. When the alert status has cleared, Grafana sends another POST request where one of the JSON values state is "ok". The sign will then clear the alert message and go back to displaying "Operational" in green.(I have plans to write a separate in-depth blog post about this. Link will be here once done!)
Future Expansion Plans
- More Environmental/Climate Sensors
- More Telemetry/Equipment Monitoring Sensors
- Action integration in case an alert meets specified criteria
- Scrape data from Ubiquity Network Controllers