In January I received an ADS-WS1 weather station from Argent Data Systems for my birthday. I ended up writing my own scripts to parse and view the data. I also serve the data to an API that I can use with other projects and applications.
Hardware
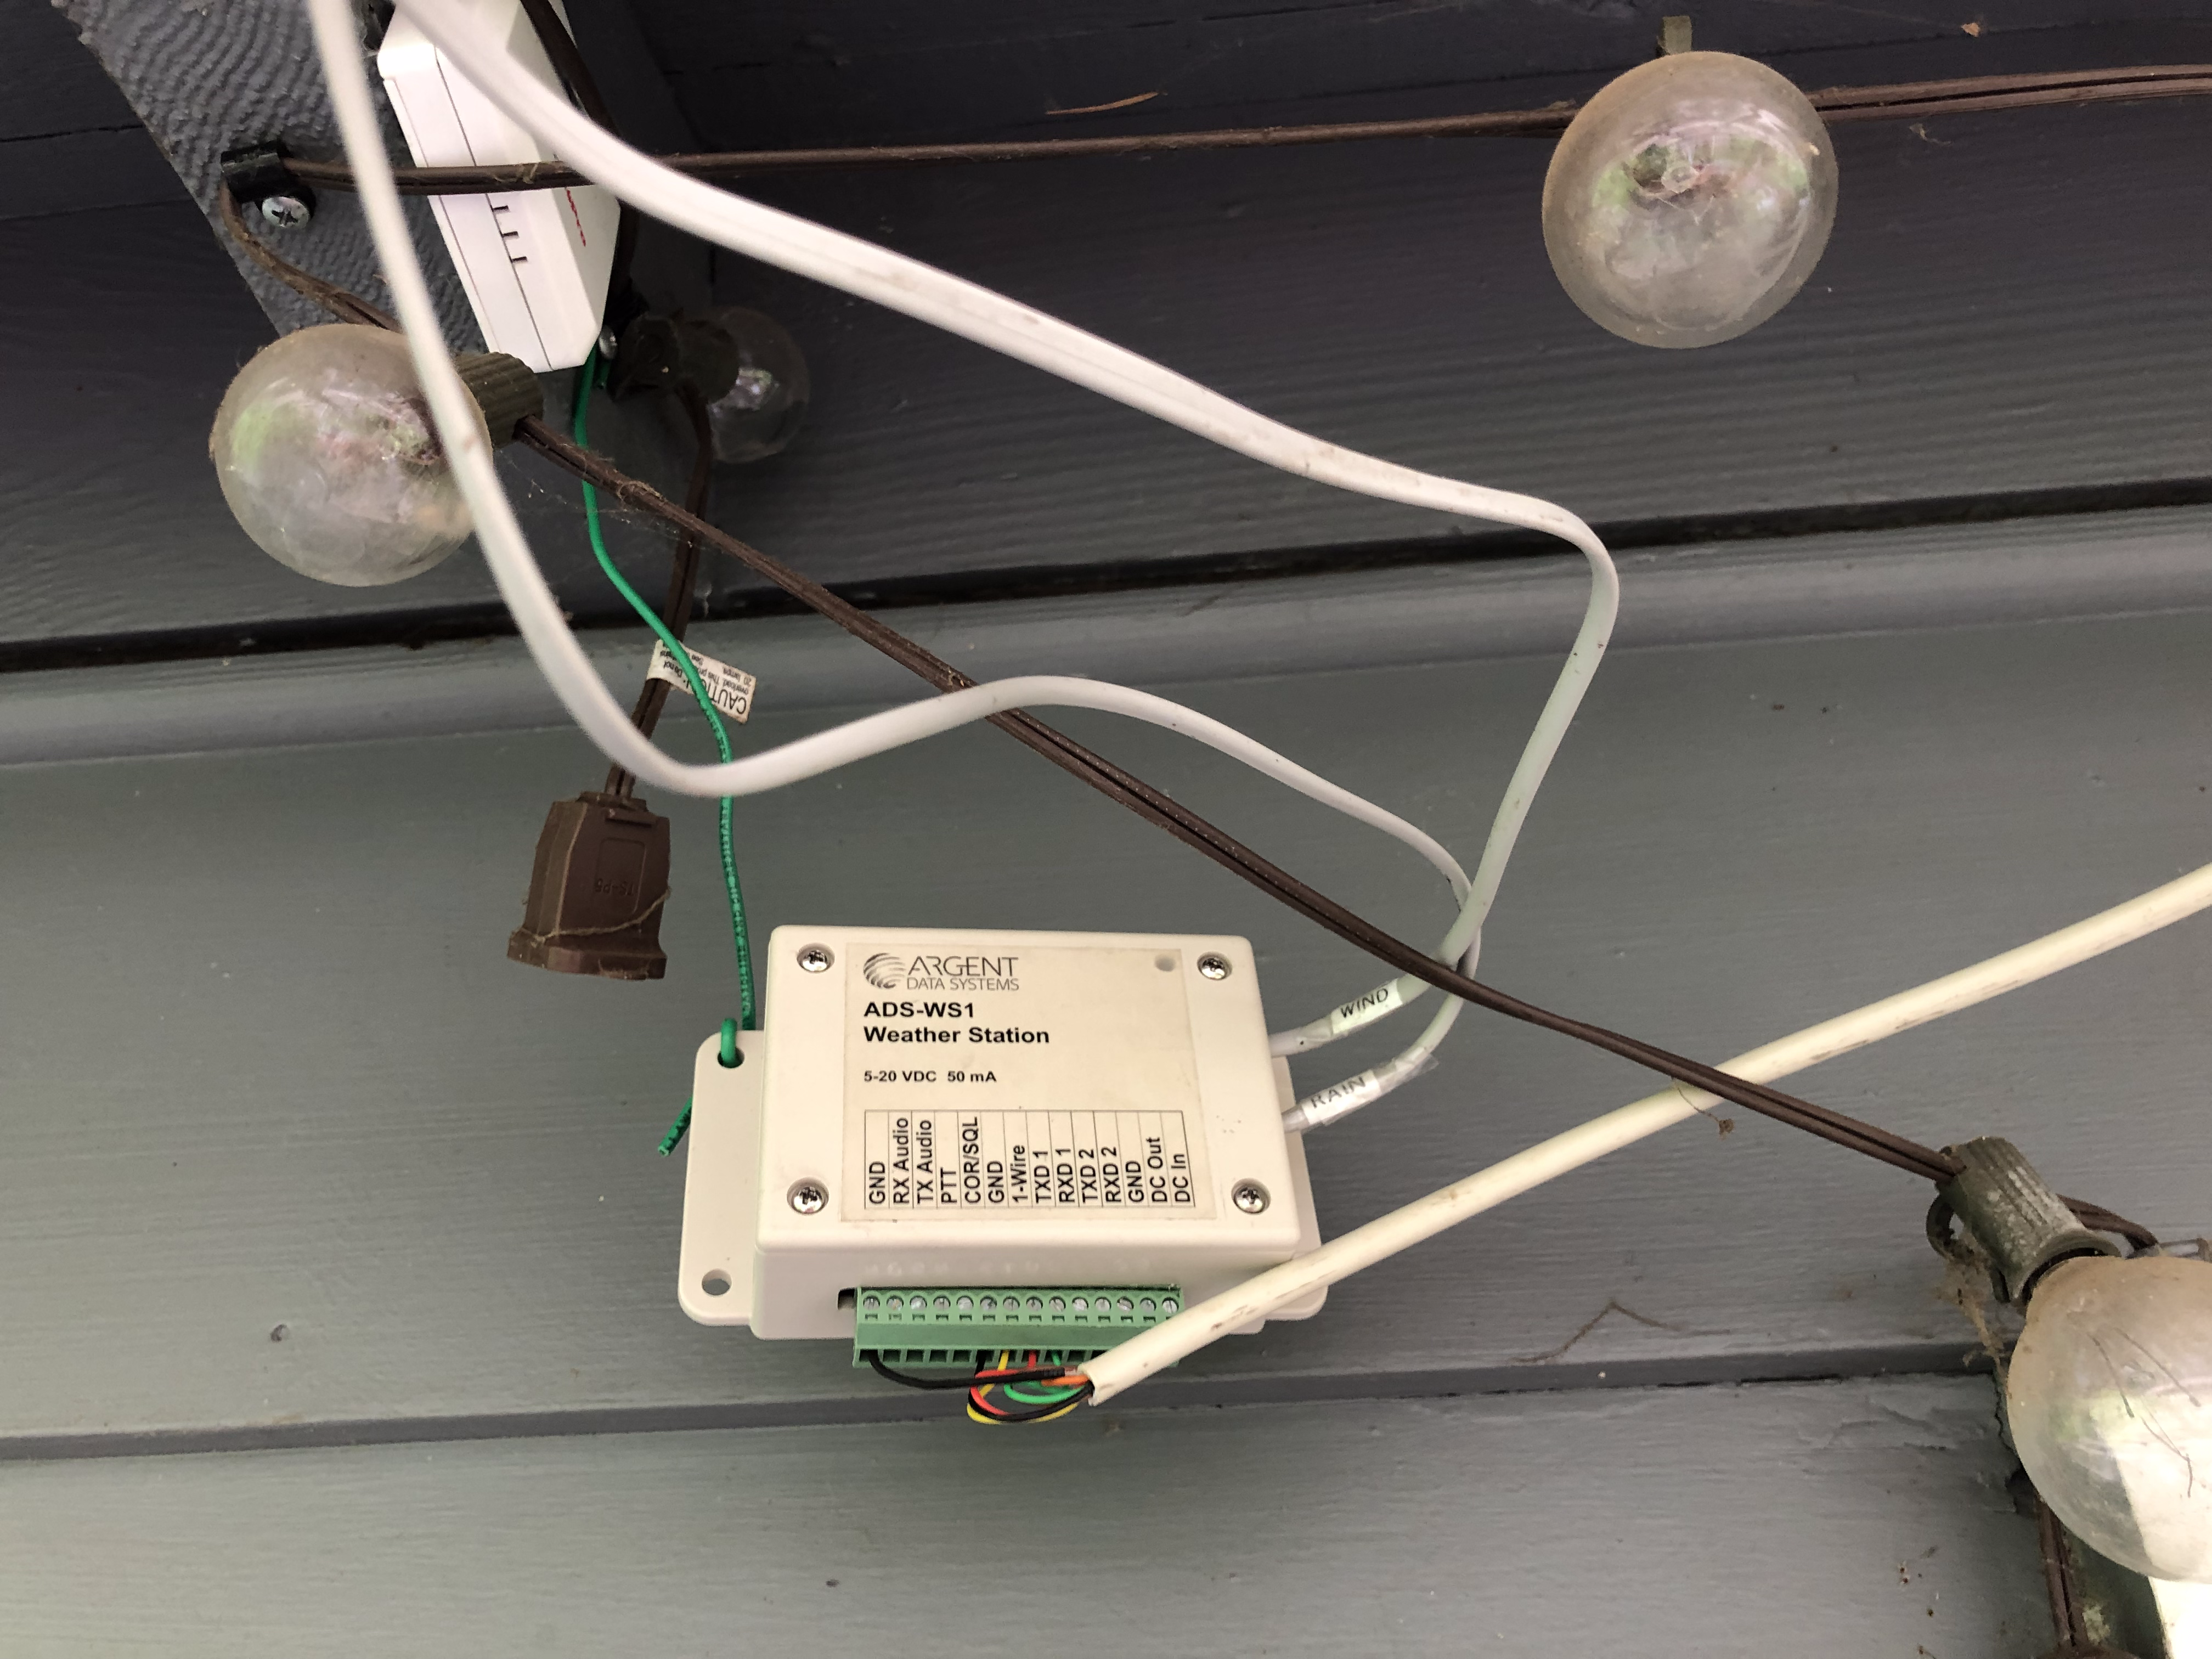
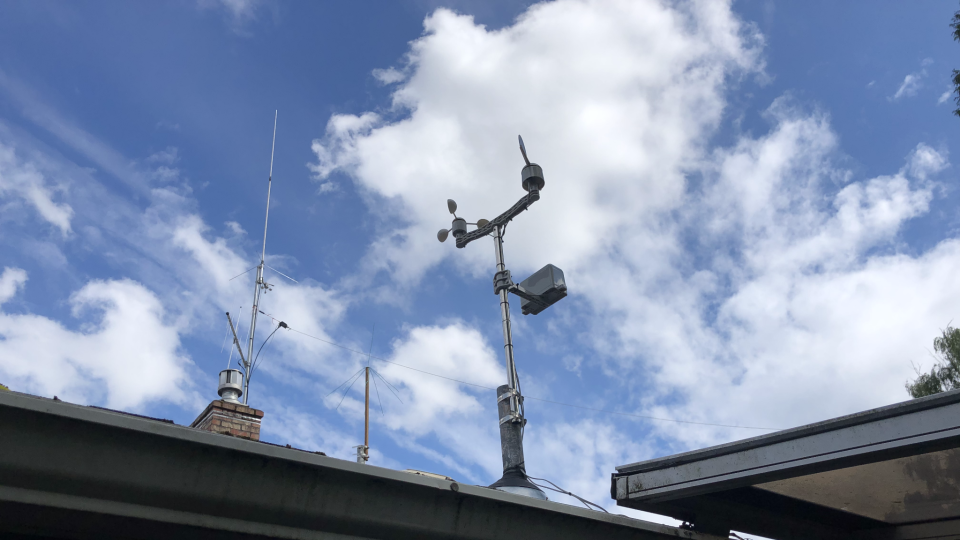
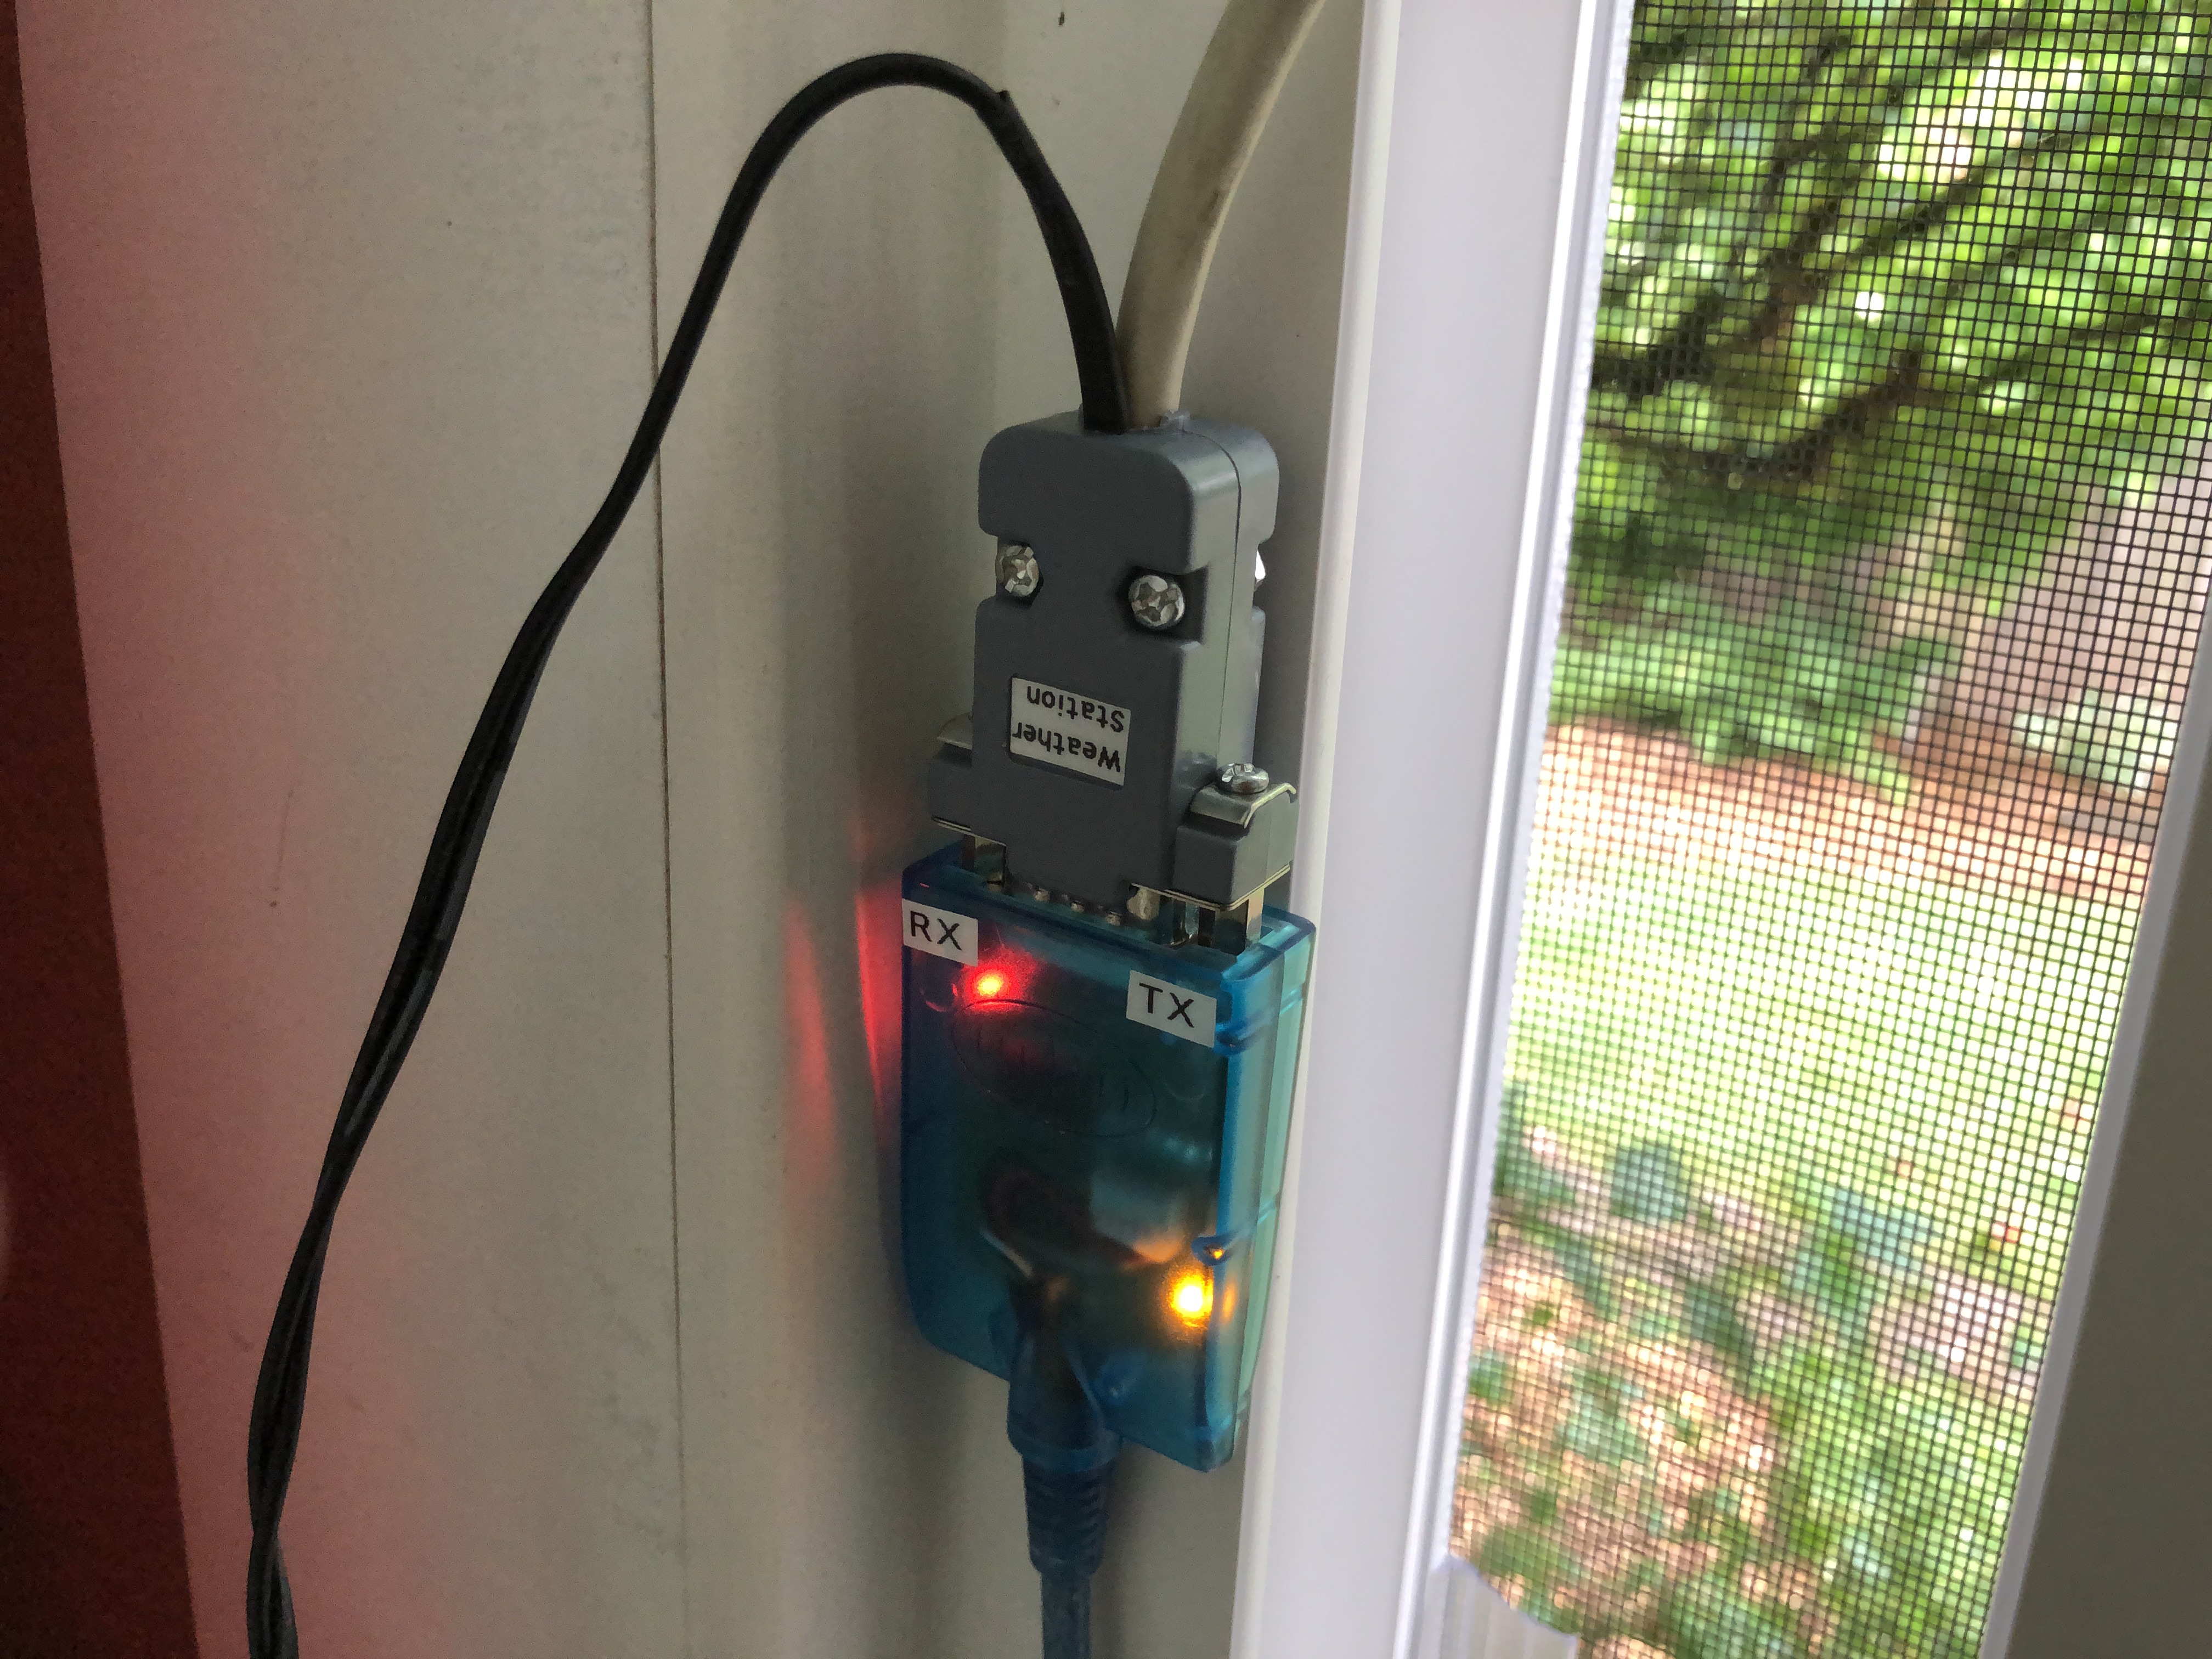
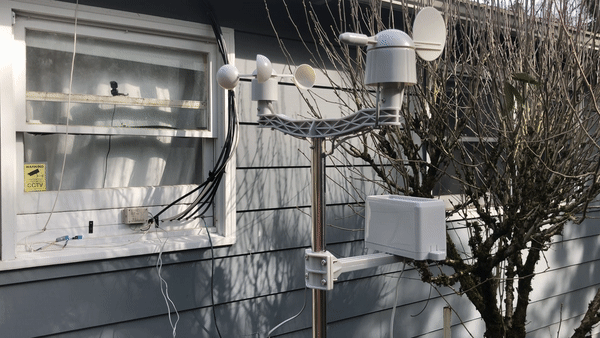
The weather station is mounted to a vent pipe on the roof. The wires go to the main control box which is mounted under the eve. I have a cable that connects to the main control box to a DB-9 and power connector in my room. The DB-9 is connected to the data TX/RX on the main control box. This allows for programming and data capture. The power is supplied with a 6 volt AC to DC converter.
It should be noted that the Temperature, Humidity and Barometric Pressure sensors are all mounted internally on the main control box's PCB. This means that the main control box has to be mounted outside. There is a way to connect an external Temperature/Humidity sensor using 1-Wire but I have not tried it nor is there any documentation on how to set it up.
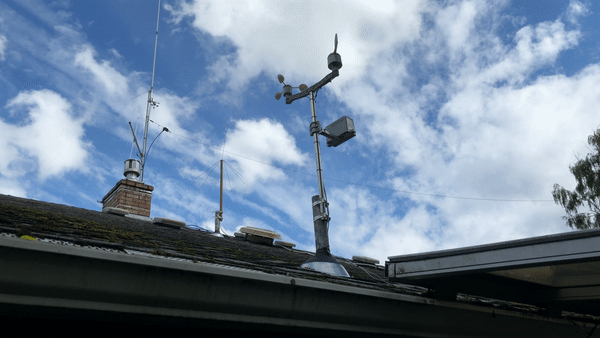
Wind instruments in action
System Overview
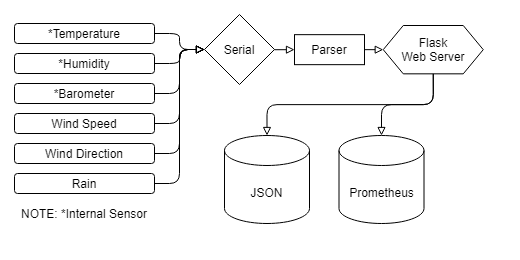
Software
The software connects to the weather station over a 2400 baud serial connection. I learned that the weather station uses a standard serial format from the Peet Bros ULTIMETER series weather stations. I then used PuTTY to view the serial data. I was able to use the documentation from peet bros and PuTTY to figure out the data formatting so I decided I should make a parser using Python.
WXparser Script
https://github.com/EvanVS/WXparser
This parser uses a Flask web server to serve a JSON, XML and Prometheus API for me to pull, log and view the data from an external source. The Prometheus data format will allow me to log the data into a Prometheus time series database for viewing with Grafana which I talked about in a separate blog post. This data can be logged or used with other scripts. For instance, I’m going to be integrating a feature into my PythonAPRS project that will allow it to pull the JSON API from the parser and beacon the data to the Amateur Radio APRS Network.
The serial data keeps the same character length without delimiter characters which means it is really easy to just pick a character range of the string to parse into a variable to be used throughout the script. The intrigues are encoded in hexadecimal and need to be converted to base 10 intrigues from the base 16 hexadecimal format. This was easily accomplished using the python int() function.
One of the first things I had to figure out was linearly mapping the wind bearing/azimuth. Like I said earlier, the data is hexadecimal to begin with so it has a range of 0-255. I needed to map the 0-255 range to 0-360 to get a proper bearing in degrees. To do this, I used some simple linear algebra. I then divided the compass bearing by 45 degrees. I then used the output from that against a dictionary to give me the abbreviation for North, South, East, West, and the 45 degree divisions between. In the end, I get a compass bearing and a degree bearing.
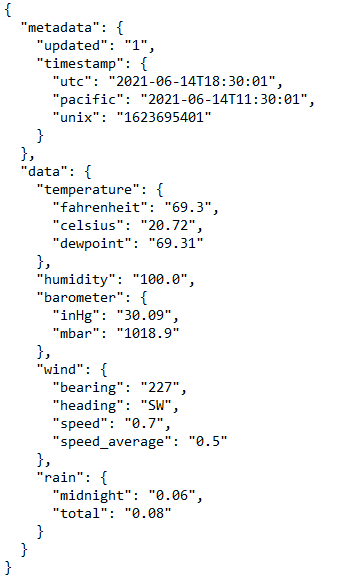
Another issue I had is that the system all runs off of a flask web server. This means any request for my weather station data has to be pulled from my home network. I made a quick PHP script that would run on my webserver that would take in data from a POST request and saves it to a file called api.json for use by any application external of my home network. The data is refreshed as its received from the weather station so its updated every second. This could be rate limited using a separate thread but I have the bandwidth to allow it.
JSON API
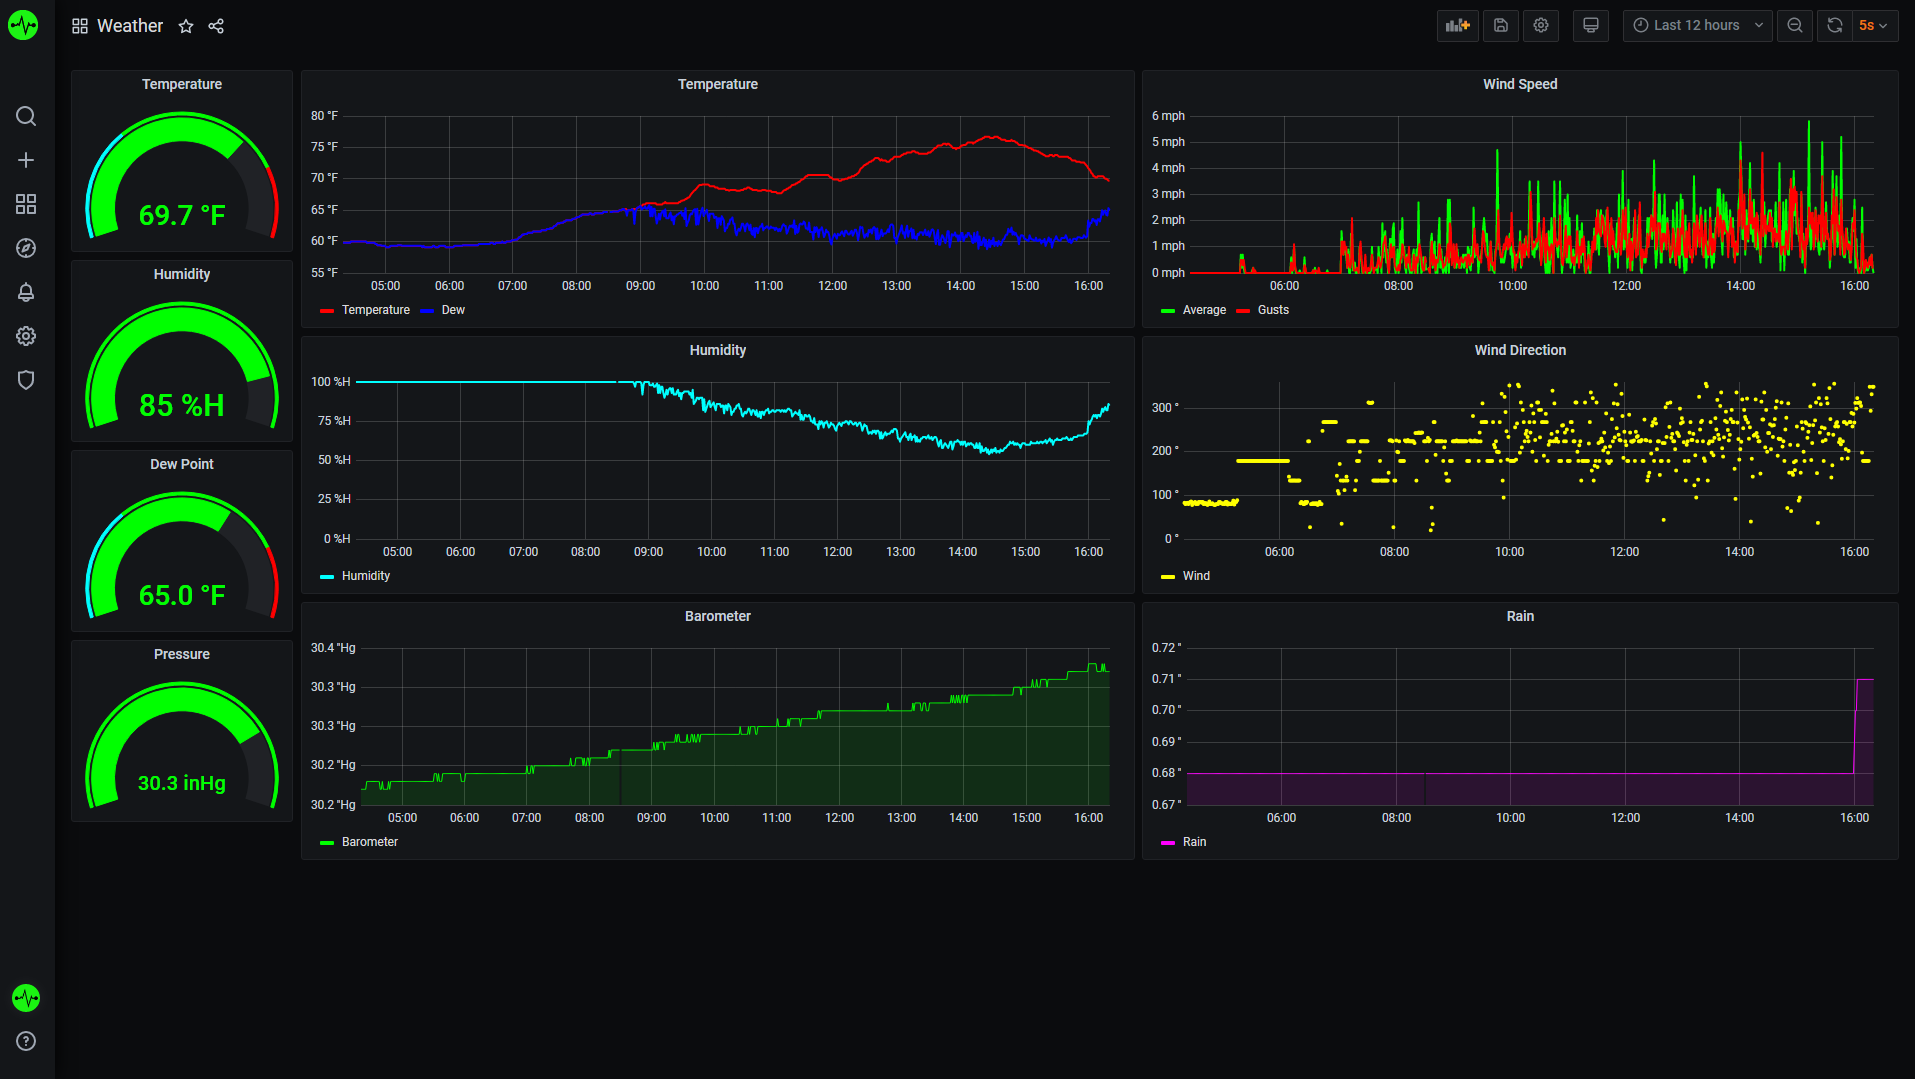
Grafana Dashboard from Prometheus Database
Calculating Hi/Lo Temps and Trends
To calculate the High and Low temperatures was relatively simple. I used a JSON file to store the highest recorded temperature and the time the data point was taken. I then compare this value to the most recently parsed data and if the data is greater than the previously record high, then it will overwrite the value and timestamp. There are many ways I could have done this but this was the simplest easy I could think of to cache the variable. I also used this concept with a few modifications to figure out the pressure and rain trends. This feature is currently not released on the github repo because its very buggy and I'm working on finding better ways to write the code that will handle these functions.
PHP HTML Embed
One thing I made to interface to the WXparser JSON API is this PHP embed. I haven't released the source for it as I'm still working on a few extra features before I release it. (If your not seeing the image above or it looks broken, I'm most likely working on it) its very much a work in progress.
Initial Testing
I wanted to include this cool GIF I made when the weather station was setup on a tripod for testing. You can see the main control box mounted on the window in the background. All the windows in my house were replaced over the coarse of this project which caused many delays so the setup no longer looks like this and is now mounted up on a vent pipe on the roof.
Future Weather Station Expansion Plans
- Weather Dashboard
- PHP Wind Radar Plot
- Lux Sensor
- Weather Camera
- APRS Support
- Weather Underground Support